Quantcast
Channel: Bryntum
Viewing all 370 articles
Browse latest View live

JavaScript Quality Assurance pt.1

$
0
0

This is the first blog post in a series of posts about our quality assurance process for our JavaScript products. For us, Quality Assurance involves dealing with bugs, handling tickets and writing test cases. All of the text in this post applies to any SW development but is extra relevant for JS/CSS development since it is just so easy to fail. Here are a few reminders of a few easy ways to fail.

  • 1. Leave an extra comma and bye bye IE. Even has its own domain. http://trailingcomma.com/
  • 2. Forget a var statement and say Hello! to a global variable.
  • 3. Use more than 4096 CSS selectors in a CSS file. More info here

How bugs spread

Let’s take look at the big picture and see what the implications are of finding bugs at different stages in your product development cycle. We will start in the most zoomed in tier (you, the developer) and gradually “zoom out” to your surroundings. Let’s say your company makes a software product sold to other businesses that include your piece of SW in their product which they then sell to end users. A bug can then be detected in these different tiers:

  • 1. Your development machine
  • 2. Your team
  • 3. Your organization
  • 4. Your customer (developers just like you)
  • 5. Your customer’s customer – the end users

Tier 1. Your development machine

bug1

In this image, it’s all about you – this is your local universe, your bubble. In this picture it is cheap and quick to find bugs. Within your bubble, bugs will eventually appear and try to escape unnoticed out into the wild. If you test your commits either manually or using a test suite your bubble will have a nice kind of safety net around it (see below). The dashed line can be seen as a net with holes as it’s simply not possible to prevent bugs from escaping completely.

bug1

No better place to find them than here, before committing to your source repository. If found here, you are already in the right context and no time consuming “task switching” is necessary.

Cost if found: None, you found it – it’s your secret.

Tier 2. Your team

Assuming you work for an organisation with more than one team contributing to the final product, your team is the next bigger tier.

bug1

If a bug you caused escapes out of your bubble into the team bubble, one of the following things can happen:

  • 1. Your automated CI test suite finds it
  • 2. Your colleague is affected by it, has to open a ticket, possibly debug => time consumed
  • 3. It goes undetected

Cost if found: Low, working time spent for your team member(s). And, you may get hurt by a foam missile fired by your CI server.

Tier 3. Your organization

bug1

Now the bug has escaped your own bubble as well as your team bubble and likely enjoys life on a QA or Staging server somewhere within your company. Other teams may also have pulled and integrated the latest (buggy) source code from your team deliverable. If you are lucky, your company has a QA team as a last line of defense. For them to find the bugs is way more expensive than if it had been found while it only existed in your own bubble. Possible scenarios:

  • 1. Your QA testers find it. Open ticket, build test case => time wasted. If critical, build will be invalidated. Release possibly delayed.
  • 2. It goes undetected

Cost if found: Expensive, possibly multiple departments involved, administrative work.

Tier 4. Your client

bug1

If the bug isn’t caught before this point, it means it is part of one of your public releases and ultimately ends up in the hands of your client. Maybe the client does their own smoke testing, maybe not. And normally you’ll have many clients, so the more clients you have – the more heat you can expect in case a low quality build is released. If they don’t find the bug, then the next and final stop is… you guessed it: The real end user.

Cost if found: Very expensive, possibly affecting company reputation.

Tier 5. The end user

shutterstock_12332866

If the bug made all the way to the client, it made a home run and will celebrate all night long. The best case now is that end user doesn’t experience it at all. More likely scenarios include:

  • 1. User accepts the bug and just lives with it
  • 2. User gets mildly annoyed and complains to your customer (who forwards the complaint to your company)
  • 3. User gets really angry and stops using your customer’s product

Cost if found: Most expensive. Very long wait for end user to get a patch. Both your company and your client company reputations suffer.

Summing up

It should now be clear that the earlier a bug is found, the less resources, time and money have to be spent fixing it. Not to mention saving the embarrassment of phone calls and emails from frustrated users. In part 2 of this series, we’ll look at some of the methods we use at Bryntum to find and fight bugs as early as possible.


JavaScript Quality Assurance pt.2 – Finding Bugs

$
0
0

shutterstock_155486141

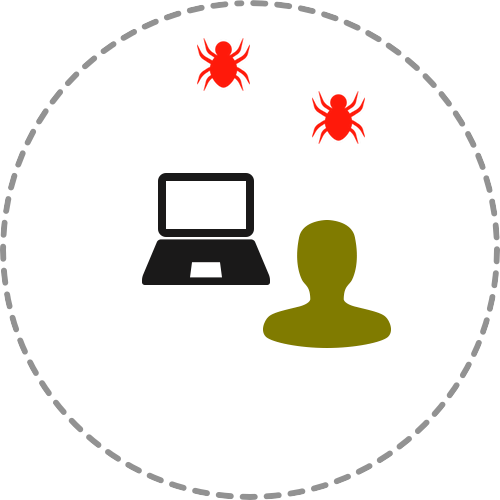
In my previous post, I provided some theory on how the cost of fixing a bug increases as it spreads across different environments inside and outside your organisation. Bugs will always try to sneak out of your workspace, contaminating the workspace of your colleagues and eventually they could end up in your customer’s browser. Since bugs are sneaky by nature, we as developers need to apply as many tricks we can to find them early. And here’s the hard part, doing this without spending too much time or resources.

Manual vs Automated testing

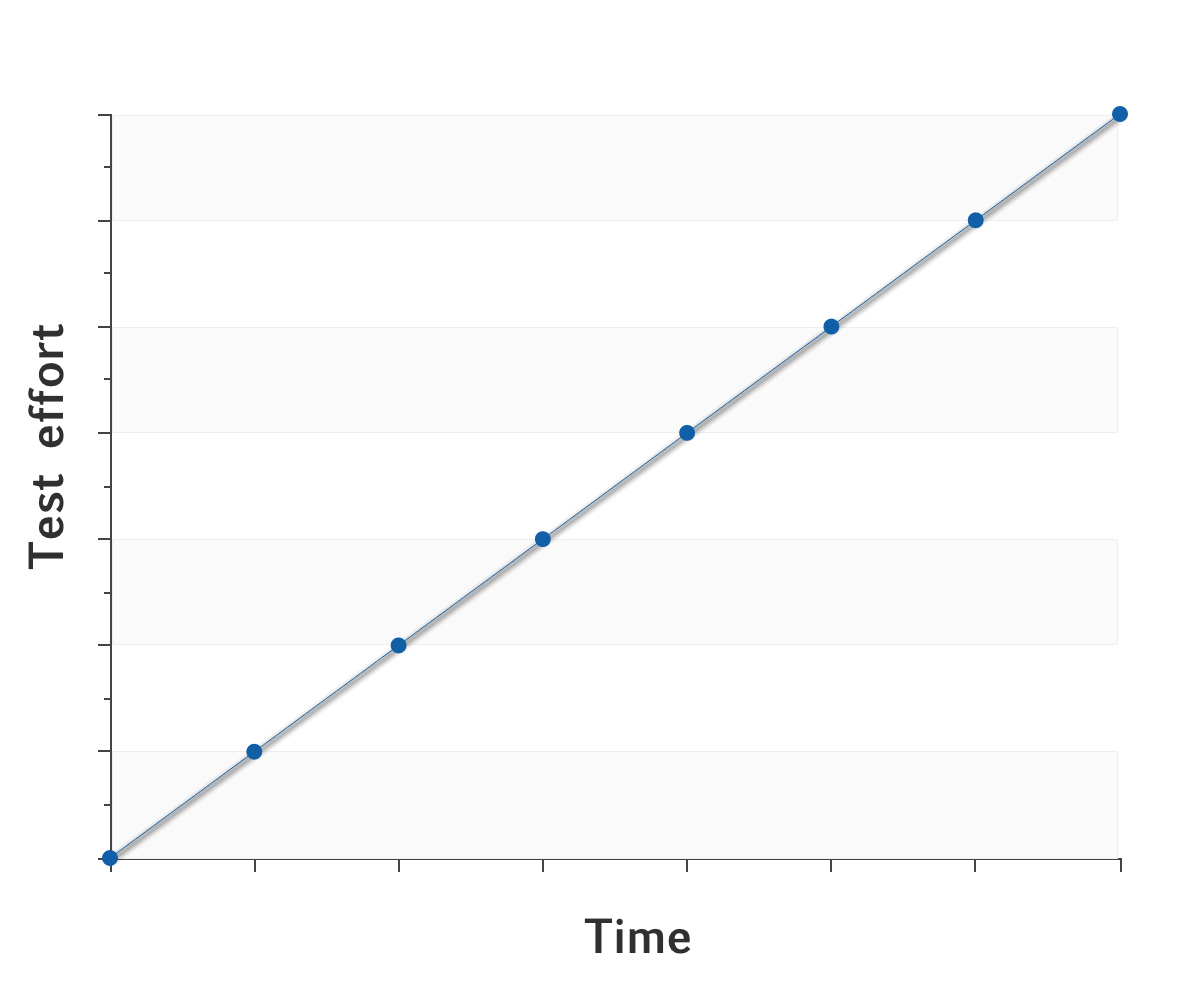
You always have the option of verifying that a feature works manually with a few clicks in the browser. This can be done by you as a developer or by a QA team. While a single test cycle using this approach is often the fastest, it does not scale as the number of features grow. Each time you need to manually test, you spend resources – your valuable time. For a commercial SW project, you definitely want to verify your system as often as possible – ideally after every commit, but realistically at least daily. The bigger your application, the bigger your test spec becomes and the more time you will need to spend.

chart

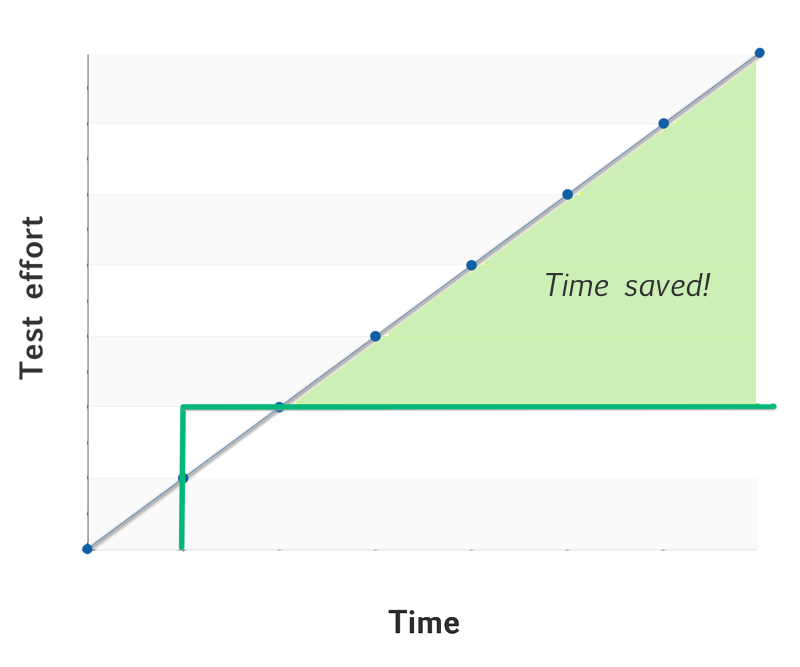
A better way to verify if a feature works is to write a unit test for it. A testing cycle in this approach of course requires some initial effort, definitely more than for one cycle of manual testing. But once written, the test can be automated and launched any number of times at no extra cost – this approach scales. See how the added green line in the chart becomes flat after the initial effort of writing the test, it can then be reused any number of time without extra cost.

chart2

At Bryntum, we rely heavily on automated tests and this allows us to keep all our products in good shape with limited resources.

When should you fight a bug by writing a test?

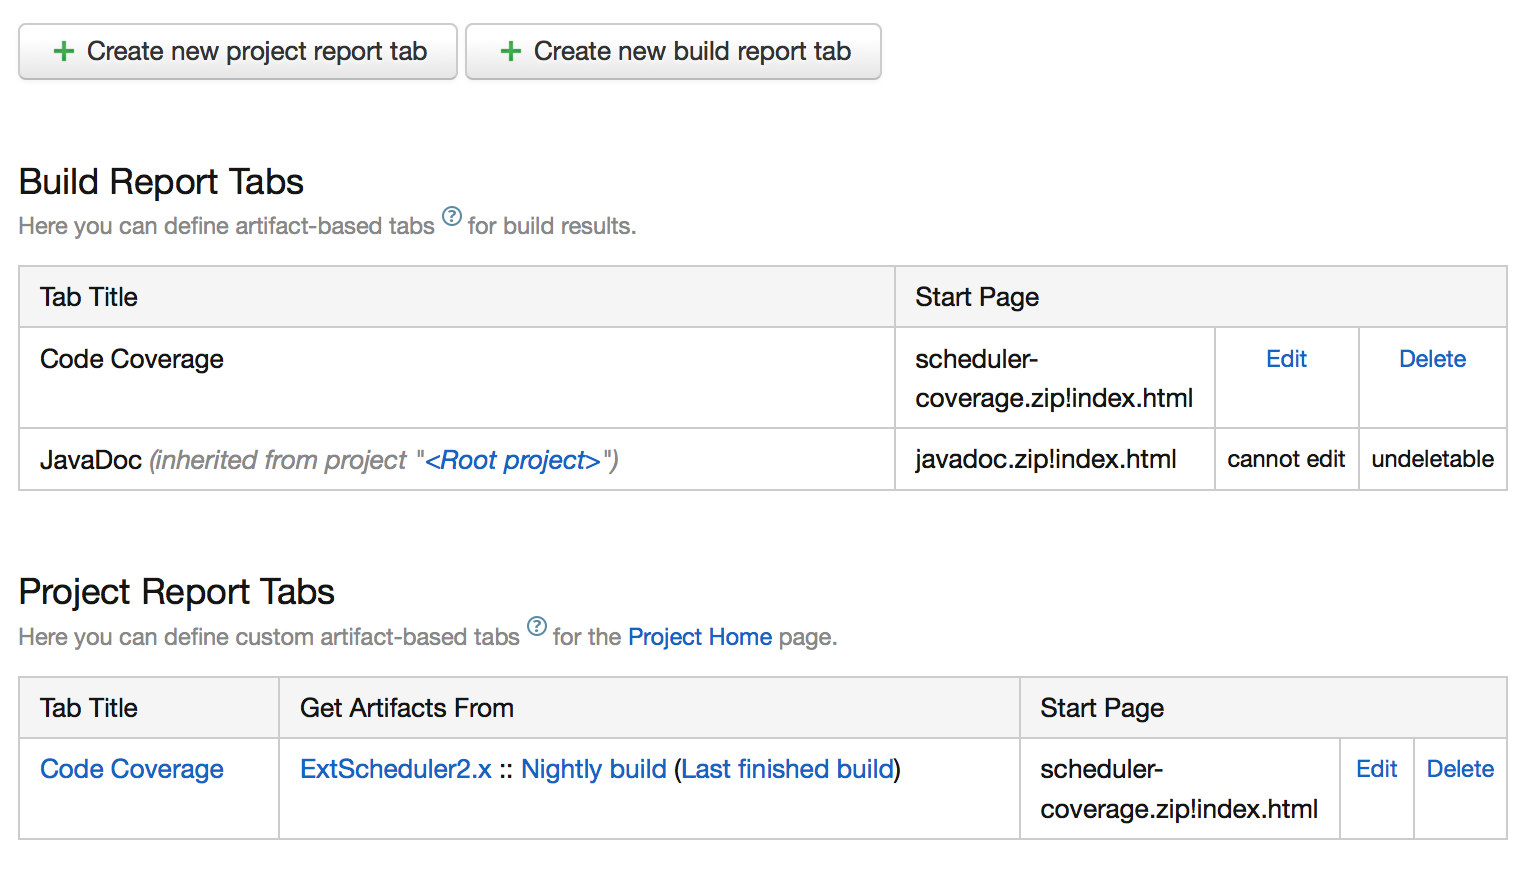
So you’ve found a bug, how do you determine if it warrants a new test case? You need to prioritize and choose carefully what you test to make sure you are not “overtesting”. Covering every possible use case with a test is not feasible, and will take too much time away from developing your product. Having a too large test suite can also be cumbersome as it will take longer and longer to complete. Speaking from my own experience at Bryntum, here is a list of questions that we use to determine if it’s time to write a new test case.

  • Will this bug affect a large number of our users?
  • Has this bug been reported before?
  • For online sample bugs, could the bug impact sales?
  • Can a test be easily written in < 10 minutes?
  • Did the bug take a lot of time and energy to investigate?

This list is not exhaustive and will of course vary from business to business.

Finding bugs.

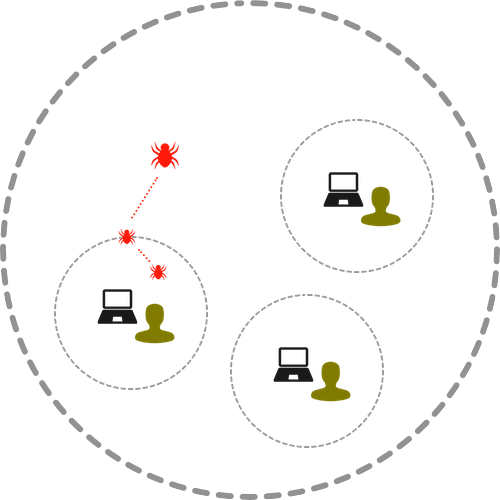
If you recall the different tiers from part 1, these are the environments where you can catch bugs in your product lifecycle.

  • 1. Your development machine
  • 2. Your team
  • 3. Your organization
  • 4. Your customer (developers just like you)
  • 5. Your customer’s customer – the end users

For these tiers, lets examine the solutions we use at Bryntum.

Tier 1 – Your development machine. The pre-commit hook

The earliest time you can find a bug is on your own machine. Once you have a decent test suite, you can run a few smoke tests prior to committing your code to the repo. This is a great way to keep the build green and developers motivated. Nothing demoralizes a dev team like a broken build. The pre-commit should at a minimum do the following:

  • 1. Verify syntax is correct. JsHint is great for this.
  • 2. Find forgotten debugger or console.log statements, as well as t.iit test
    statements (very easy to forget in your tests)
  • 3. Run a few select smoke tests

The smoke tests should focus on preventing the most simple errors and it should also assure that the most critical parts of your codebase are ok. These smoke tests should run fast, fast, fast. This is not the place to run all your advanced UI tests, that will simply take too long. We use the awesome PhantomJS to run a subset of all our unit tests (which are not DOM related) along with a few UI tests. All in all, this pre-commit takes around 10 seconds and keeps our source repo in good shape. Here’s our current pre-commit hook:

#!/bin/bash

# 1. Run JsHint
# ----------------------
jshint $(git diff --cached --name-only --diff-filter=ACMRTUXB | while IFS= read -r line; do

    if [[ $line =~ ^js\/.*\.js$ ]]; then
        echo $line
    fi

done)

if [ "$?" != "0" ]; then
    exit 1
fi

echo "JSHint sanity test passed correctly"

# passthrough the exit status of the failed pipe subshells
set -o pipefail

# 2. Look for forgotten t.iit statements in tests
# ----------------------
git diff --cached --name-only --diff-filter=ACMRTUXB | while IFS= read -r line; do
    if [[ $line =~ ^tests\/.*\.t\.js$ ]]; then

        cat $line | grep -q '.iit('
    
        if [ $? == "0" ]; then
            echo "t.iit() statement found in file: $line"
            # will exit a pipe-subshell only, need additional check below
            exit 1
        fi
    fi
done

if [ "$?" != "0" ]; then
    exit 1
fi


echo "No t.iit statements found"

# 3. Run smoke tests
# ----------------------

../siesta/bin/phantomjs http://lh/ExtScheduler2.x/tests/index-no-ui.html?smoke=1 --pause 0 --no-color

exit $?

Once you’re happy setting up your pre-commit hook, you should also ensure that everyone uses it. We do this by adding an extra step in our build script, which copies the pre-commit file into the .git folder. This way we know all developers share the same hook.

# install the pre-commit hook
cp build/pre-commit .git/hooks/

Tier 2 – Your team. The automated test suite

The pre-commit hook is a great tool for preventing bugs from sneaking out of your development machine, but the best weapon by far for finding bugs is an automated test suite. The test suite covering your JavaScript code base should ideally be executed at least once per day in all the browsers you support. At Bryntum we test all products nightly, in IE8/9/10, Chrome, Firefox and Safari. In the morning when our developers start their work, they already have an email in their inbox with the most recent results. Broken tests have the highest priority for us, as they indicate something is broken in the product which means we cannot ship.

Monkey love

shutterstock_33253210

As I mentioned earlier, since bugs are sneaky creatures you need to apply every trick you have against them. One testing concept that I’m a big fan of is Monkey testing, which means simulating random input to the UI and observing what happens. As part of testing our Ext Scheduler product and running our nightly build, we monkey test each of of our 45+ examples which over the years has found us many many bugs, for free. Let me repeat that using a larger font.

FOR FREE

This is naturally a huge help for a small company like us with limited resources. Here’s the test we use to make sure our examples render and do not produce any exceptions when attacked by a hoard of monkeys.

t.waitForSelector('.sch-timetd', function() {
        t.pass('Scheduler example rendered without exception');
        
        t.monkeyTest('>>schedulerpanel', 10);
    });

The ROI here is enormous, we write one simple t.monkeyTest statement and magic bug-hunting monkeys appear. What more can you ask for, really? In the line above, “>> schedulerpanel” means a Component Query matching “schedulerpanel”, and the second argument (10) specifies how many random actions (clicks, types, drags etc) should be performed.

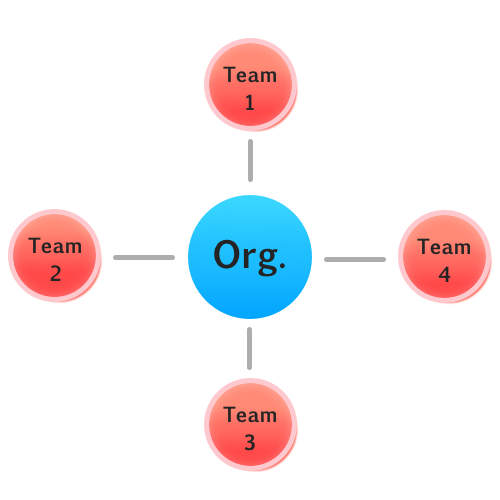
Tier 3 – Your organization

Just as monkey testing helps us find bugs for free, we can make use of the visitors trying the live examples on our site. When someone is clicking around in our samples and an exception is thrown – we can know about it easily using a window.onerror hook. We do this for all of our online samples and it has also allowed us to find quite a few bugs for free (although at a much later stage than the monkeys). Each time an exception is thrown in one of our online examples, the following information is gathered and emailed to our developers:

Message: Uncaught TypeError: Cannot call method 'disable' of null 

Url: http://www.bryntum.com/examples/gantt-latest/examples/advanced/js/Toolbar.js?_dc=1390056859111 

Line: 12 

Href: http://www.bryntum.com/examples/gantt-latest/examples/advanced/advanced.html

Browser: Chrome32

Product version: 2.2.16

Local date: Sat Jan 18 2014 21:55:11 GMT+0700 (SE Asia Standard Time)

As you can see above, we collect the error message, browser + version and also the local date which can be useful information in case the bug is related to a certain timezone.

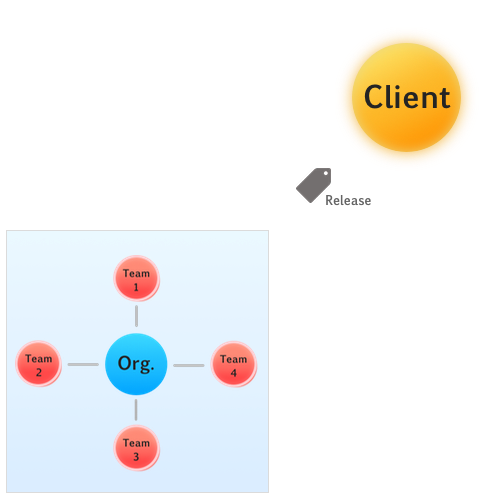
Tier 4 and 5 – Your customer and end users

If a bug has reached these tiers, it is out of your control. It is important to have a clear and efficient procedure for resolution of such bugs. At Bryntum we use a bug tracker tool by Assembla: https://www.assembla.com/spaces/bryntum/support/tickets. This tool allows us to communicate efficiently with the bug reporter and provides transparency for our customers.

We should also mention that it’s not enough to simply fix the bug. It is equally important to deliver a patch to the customer. For this purpose we use a rapid development cycle and our release cycle is usually about 2-3 weeks. If a critical bug is found, it is fixed (along with a new test of course) and a new release is initiated. Additionally, we also publish our nightly builds which means our customers can verify a bug fix the day after a bug has been corrected.

A real world story

Here’s a typical example of one Bryntum bug life cycle, which starts at tier 4.

A week or two ago, a bug report was filed about the resizing of tasks in Ext Scheduler under certain circumstances (Ticket status – New). It turned out, after a bit of manual testing that if you were changing the duration of a task and just moved the mouse a few pixels, the resize operation behaved weirdly and exceptions were seen. (Ticket status – Accepted). Since the Scheduler fires events at different stages during a resize operation, my guess was that the operation wasn’t finalized properly. This turned out to be correct. I assigned this bug to myself and wrote a test, since I felt the resize feature is quite important for every user and it would be very easy to test (see point 4 in the list above). Here’s the extremely simple test I wrote which took less than 5 minutes to write:

t.it('Should finalize if mouse only moves a little', function(t) {
        var scheduler = t.getScheduler({
            renderTo : Ext.getBody(), 
            height   : 200 
        });

        t.firesOnce(scheduler, 'beforeeventresize')
        t.firesOnce(scheduler, 'eventresizestart')
        t.firesOnce(scheduler, 'eventresizeend')

        t.chain(
            { waitFor : 'eventsToRender', args : scheduler },

            { drag : '.sch-resizable-handle-end', by : [3, 0] }
        );
    });

Note the use of our convenience method getScheduler which helps us reduce the amount of boilerplate test code. As I ran the test, this is what I saw in my WebStorm output window.

run-phantom lh/ExtScheduler2.x/tests/index-no-ui.html --filter 062_resize.t.js --pause 0

fail 4 - Observable fired expected number of `eventresizeend` events
Failed assertion `firesOk` at line 139 of event/062_resize.t.js?Ext=4.2.1
Actual number of events   : 0
Expected number of events : 1

[FAIL]  event/062_resize.t.js?Ext=4.2.2

3 passed, 1 failed assertions took 0.983s to complete

And that’s the proof I needed, the eventresizeend was not fired in this case. After adding a simple fix for this case in our source code, the test turned green and I could no longer reproduce the issue (Ticket status – Resolved).

Note, that from this point, if this bug were to ever appear again in our product – it would be caught by our test suite in Tier 2 without any additional effort from me.

That’s it for part 2…

In this post I’ve mentioned a few tricks and habits we employ at Bryntum to make sure we find bugs as early as we can and ship high quality software. In the next part of this series, we’ll look at the Continuous Integration side of things and how our nightly builds work.

The new Sch.plugin.HeaderZoom plugin for easy zooming

$
0
0

We have just released Ext Scheduler 2.2.17 which includes a plugin called “Sch.plugin.HeaderZoom”. This allows you to very quickly zoom in to a selected time span by using drag and drop. The plugin itself is extremely simple, and the full source can be seen below.

Ext.define("Sch.plugin.HeaderZoom", {
    extend        : "Sch.util.DragTracker",
    mixins        : [ 'Ext.AbstractPlugin' ],
    alias         : 'plugin.scheduler_headerzoom',
    lockableScope : 'top',

    scheduler      : null,
    proxy          : null,
    headerRegion   : null,

    init : function (scheduler) {
        scheduler.on({
            destroy : this.onSchedulerDestroy,
            scope   : this
        });

        this.scheduler      = scheduler;

        scheduler.down('timeaxiscolumn').on({
            afterrender : this.onTimeAxisColumnRender,
            scope       : this
        });
    },

    onTimeAxisColumnRender : function (column) {
        this.proxy = column.el.createChild({ cls : 'sch-drag-selector' });

        this.initEl(column.el);
    },

    
    onStart : function (e) {
        this.proxy.show();

        this.headerRegion   = this.scheduler.normalGrid.headerCt.getRegion();
    },

    
    onDrag : function (e) {
        var headerRegion    = this.headerRegion;
        var dragRegion      = this.getRegion().constrainTo(headerRegion);
        
        dragRegion.top      = headerRegion.top;
        dragRegion.bottom   = headerRegion.bottom;

        this.proxy.setRegion(dragRegion);
    },

    
    onEnd : function (e) {
        if (this.proxy) {
            this.proxy.setDisplayed(false);

            var scheduler   = this.scheduler;
            var timeAxis    = scheduler.timeAxis;
            var region      = this.getRegion();
            var unit        = scheduler.getSchedulingView().timeAxisViewModel.getBottomHeader().unit;
            var range       = scheduler.getSchedulingView().getStartEndDatesFromRegion(region);
            
            scheduler.zoomToSpan({
                start   : timeAxis.floorDate(range.start, false, unit, 1),
                end     : timeAxis.ceilDate(range.end, false, unit, 1)
            });
        }
    },

    
    onSchedulerDestroy : function () {
        if (this.proxy) {
            Ext.destroy(this.proxy);

            this.proxy = null;
        }

        this.destroy();
    }
});

Using it in your SchedulerPanel is as easy as doing:

var scheduler  = new Sch.panel.SchedulerGrid({
    plugins     : [
       new Sch.plugin.HeaderZoom()
    ]
});

Instead of describing what it does, here’s a short demo video showing it in action. You can also try it out live here. We hope you’ll find it a useful addition to our codebase.

Siesta Tips-n-Tricks: Extending the Test class

$
0
0

One great aspect of Siesta is its extensibility. It’s designed from the core to be customizable and overridable by anyone using it. After you have written a few tests, you likely find some repeated lines of code, violating the DRY principle. This is when you should extend the built-in Siesta test class. In your own test class you can put snippets of code that you use a lot throughout your tests, this is well described in our guide on how to extend the Siesta.Test class with your own abstractions. In this blog post I want to show you another cool trick you can use to do very cheap but useful sanity testing.

A recent bug report…

We recently had a bug report filed which caused a strange rendering artifact in the Scheduler component. In essence, the grid implementation stopped rendering properly. It felt really strange as we don’t override the rendering mechanism of the underlying Ext JS Grid class but after a while (a quite long while) we found the culprit. In one place we forgot to call Ext.resumeLayouts() after calling Ext.suspendLayouts(). This is a really tricky thing to debug and figure out, as this bug doesn’t cause any runtime errors – only visual unpredictable rendering quirks. Since I really didn’t feel like debugging this one more time, I decided to override the initialize template method of our Bryntum.Test class (which extends Siesta.Test). In this method I can easily inject a listener for the ‘beforetestfinalize’ event which is fired just before each test is completed. This gives us a great hook to do per-test sanity checks, such as verifying that no layouts are suspended. We use a bit of Ext.ComponentQuery to detect any components with layouts suspended:

// Use the power of Ext CQ
Ext.ComponentQuery.query('{isLayoutSuspended()}')

The final snippet took about 5 minutes to write. Even better for you, as it’ll only take you about 5 seconds to copy paste this into your own Test class and you (and your customers) will never face this hard-to-debug rendering issue.

Class('Bryntum.Test', {

    isa : Siesta.Test.ExtJS,

    methods : {

        initialize : function() {
            this.SUPERARG(arguments);

            this.on('beforetestfinalize', function() {
                var win     = this.global;

                if (win.Ext) {
                    var suspendedComponents = this.cq('{isLayoutSuspended()}');

                    // only report in case of failure
                    if (suspendedComponents.length > 0) {
                        this.diag('POST TEST SANITY CHECKS');

                        this.is(suspendedComponents.length, 0, 'No components found with layouts suspended');

                        this.fail('Suspended layouts detected for components', {
                            annotation : Ext.Array.map(suspendedComponents, function(cmp) { return (cmp.id + '(' + cmp.xtype + ') ') }).join('\r\n')
                        });
                    }

                    if (win.Ext.AbstractComponent.layoutSuspendCount > 0) {
                        this.is(win.Ext.AbstractComponent.layoutSuspendCount, 0, 'Layouts should not be suspended globally by accident');
                    }
                }
            });
        }
    }
});

Any suggestions of other cool sanity tests that could be done this way? Let your voice be heard!

Happy testing!

The New Kanban Task Board Component

$
0
0

We recently announced the initial release of our new Task Board UI component. Kanban and Scrum are two popular techniques for managing the software delivery process in a company, and both these techniques make use of task boards.

taskboard_hero

A task board typically contains the tasks that members of a team are currently working on, and the board can look a bit different depending on the company process. Our new component comes pre-configured with 4 simple ‘swim lanes’ for the basic task states: “Not Started”, “In Progress”, “Test” and “Done”. Of course it can be configured to use any task states, and show any number of swim lanes in any layout. This is thanks to the powerful Ext JS layout system which makes this really easy.

Easy Implementation

The TaskBoard is built using basic standard Ext JS classes, such as DataView, Panel, Store so if you are familiar with these classes, implementing the TaskBoard will be a downhill walk in a sunny park. Here is a sample of a very basic implementation:

var resourceStore = new Kanban.data.ResourceStore({
    data    : [
        { Id : 1, Name : 'Dave' }
    ]
});

var taskStore = new Kanban.data.TaskStore({
    data    : [
        { Id : 1, Name : 'Dig hole', State : 'NotStarted'}
    ]
});

var taskBoard = new Kanban.view.TaskBoard({
    resourceStore : resourceStore,
    taskStore     : taskStore
});

var vp = new Ext.Viewport({
    items       : taskBoard,
    layout      : 'fit'
});

Swimlane Layouts

You can configure the board to use any layout, and even split the swimlanes both vertically and horizontally. Here are some samples to give you an idea of what you can do:

layout1

layout2

layout3

Drag drop validation

After you have defined the different states that your tasks can be in, you should also define how the tasks can be moved around in the board. This is very easy to define, simply override the isValidTransition method of the Task model class. The default implementation looks like this:

/**
     * @method isValidTransition
     *
     * Override this method to define which states are valid based on the current task state. If you want to allow all,
     * simply create a method which always returns true.
     *
     * @param {String} toState The new state of this task
     * @return {Boolean} true if valid
     */
    isValidTransition : function (toState) {

        switch (this.getState()) {
            case "NotStarted":
                return toState == "InProgress";
            case "InProgress":
                return toState != "Done";
            case "Test":
                return toState != "NotStarted";
            case "Done":
                return toState == "Test" || toState == "InProgress";

            default:
                return true;
        }
    }

Test suite

As with all our other products, the TaskBoard ships with a Siesta test suite covering the various APIs and core functionality. You can run this yourself easily, by opening the /tests folder of the SDK in a web browser.

Screen Shot 2014-03-31 at 17.34.33

Give it a spin…

You can try the new TaskBoard right now, just click here. As always, we really value your feedback so please leave a comment or send us an email with your thoughts.

Additional links

A first look at Ext JS 5

$
0
0

With the recent announcement of the first public Ext JS 5 beta, we thought it would be cool to take a look at it and take it for a spin. Since we’re a group of seasoned Ext JS developers, we’re very interested in the under-the-hood updates and technical details. We thought we would take a look at memory footprint, performance and breaking API changes. Additionally – since we rely heavily on the Grid component we are also curious about any changes to it, and its performance benchmarks.

A First Look

Screen Shot 2014-04-08 at 17.06.22

The first thing we notice is that the ext-all-debug.js file looks very small. And in deed it’s not the real ext-all-debug.js file, and your application cannot use it out of the box. If your application uses one of the ext-all-XXX.js files, you need to update your include paths to point to /build/ext-all-XXX.js instead. Same goes for the CSS all-file, the ext-all.css can now be found in /packages/ext-theme-classic/build/resources/ext-theme-classic-all-debug.css. Now when we know where to find the relevant files, let’s create a simple sample and investigate the memory usage.

Memory Footprint

Including ext-all.js on an HTML page has the following memory footprint in Chrome on a MacBook Pro we used.

Ext JS 5.0.0.736

// Memory footprint
console.memory.usedJSHeapSize    // 27600000

Ext JS 4.2.2

// Memory footprint
console.memory.usedJSHeapSize    // 13400000

The memory footprint of including the entire Ext JS library has doubled. Note, that this is not likely something your application would suffer from since Sencha Cmd will help you custom build the minimum footprint by inspecting the Ext JS classes your application uses.

Grid Performance

We continued to look at the grid performance and tweaked one of the locking grid examples and opened it in a newly restarted Chrome. You can see the test case in this Sencha Fiddle. We added 1000 records to the store and measured the rendering time. After rendering we inspected the number of elements created when rendering such a large grid. The Ext 5 grid now uses a table for each row, to avoid putting too much pressure on the browser when laying out and updating a huge table. The ‘cost’ is naturally more elements in the DOM as can be seen in the comparison below.

Ext JS 5.0.0.736

// Initial render time
console.timeEnd('render') // 620ms 

// Checking total number of DOM elements 
Ext.select('*').getCount()       // 18101

Ext JS 4.2.2

// Initial render time
console.timeEnd('render') // 650ms 

// Checking total number of DOM elements 
Ext.select('*').getCount()       // 14113

Based on these numbers, the render time has improved slightly. Just as the grid in 4.2.2, the new grid renders really fast even with 1000 rows and buffered rendering disabled. Though even with a faster grid rendering, when using deferInitialRefresh : true (default), there seems to be some post processing (either in Ext JS or the browser layout) and the grid doesn’t respond to scrolling for another second or two. When we set this flag to false the grid is responsive immediately after rendering.

Another important aspect of the grid is how responsive it is when data changes. We added a button to our sample which does 200 record updates.

buttons : [
    {
        text    : 'updates',
        handler : function () {
            console.time('update')
            for (var i = 0; i < 200; i++) {
                store.getAt(i).set('company', 'foo');
            };
            console.timeEnd('update')
        }
    }
]

Ext JS 4.2.2 takes 126 seconds (!) to complete this task. The browser is completely frozen and unresponsive during this time. With Ext JS 5, the update task takes 13 seconds. About a 10x speed increase for this case. This is of course an extreme scenario, you should not render this many rows to the DOM, instead you should use the buffered rendering feature in Ext JS.

Backwards Compatibility

Another area which is particularly interesting to monitor in the case of a major version upgrade is the backwards compatibility. Remembering the messy Ext JS 3 to 4 upgrade, we were hoping for a clean and simple upgrade process this time. Then again, since we know we have a few overrides of private methods and use a few private properties we were expecting to find a few hurdles to jump over. To better prepare ourselves for the upgrade, we decided to build a simple diff tool which compares two versions of Ext JS and highlights removed and changed class properties. This turned out to be a quite easy task which gave us some interesting information. You can see the results here.

Screen Shot 2014-04-09 at 10.38.26

The tool inspects all Ext JS JavaScript symbols, classes and prototypes to see what has changed. It makes no distinction between private and public properties, so most of the information it shows will be irrelevant to you. It will be interesting however, if you rely on some private Ext JS methods or properties, and such properties are removed or changed in Ext 5. This should not be considered a breaking change, Sencha refactoring private code is expected and your application code should naturally rely as little as possible on undocumented parts of the framework. The output from this tool should not be considered as the full truth, and may contain errors or missing changes. If you want to try it out yourself, you can find this tool on GitHub and hopefully it can help you find vulnerable parts in your code base before you start your upgrade process.

Breaking Changes In Ext JS 5

We have mainly looked at issues we found when trying our own upgrade. Mainly we have inspected the GridPanel class, its related classes and the data package so far, so this list is most likely incomplete. Here are a few things to look out for if you want to try to upgrade to the Ext JS 5.0.0.736 build.

Ext.data.Model – fields. This property has changed from being a MixedCollection and is now a native Array.

Ext.data.Model – modified. This property has changed its default value, from being {} and is now undefined. If you check this modified object in your codebase, you now first need to check for its existence.

Ext.grid.View – itemSelector. Grid rows used to be rendered as a simple TR node, this property is now “.x-grid-item” and if you have CSS styling relying on this selector you need to update your CSS.

Ext.fly(el).on. In Ext 5, you cannot use a FlyWeight element to attach event listeners. You now need to use Ext.get instead.

Unique Model Names. In Ext 5, you cannot currently have two models in different namespaces with the same suffix. Example: Defining Foo.bar.Model and later Foo.other.Model will throw an exception in the current Ext JS 5 beta. This has been reported here.

Ext.util.Observable – addEvent. addEvents has been deprecated and will lead to an exception if called. Calls to addEvents can be safely removed (even in Ext 4.x).

Conclusion

Overall, the Ext JS 5 package looks solid. New great looking themes, new features and only a few glitches detected so far. We were actually able to get the Scheduler component rendered and working within a few hours which is very promising – screenshot below.

Screen Shot 2014-04-04 at 16.34.01

We’ll continue to monitor the coming Ext 5 betas and update our tool to show the latest changes in the framework. If you have any feedback of how we can improve the diff tool or if you have found any other breaking change we should know about, please post in our comments or forums.

Additional Resources

Tips ‘n Tricks: Rendering Meta Data In The Timeline Header

$
0
0

Today we released new versions of Ext Scheduler and Ext Gantt. As part of the new scheduler release, we updated two of the examples to show off some cool header rendering tricks. In our mail inbox, one common question we get is “How do I render a summary in the timeline header?”. This question can now be easily answered by checking out these samples.

Rendering text into the timeline header

Screen Shot 2014-05-05 at 16.12.22

Let’s say you want to show some type of summary showing how many tasks exist for each day in the schedule. To do this, all you have to do is to create a custom view preset and devote the bottom row to rendering your summary. Here’s how you create and register a new custom preset which produces the output in the image above (from the updated ‘timeaxis‘ sample):

Sch.preset.Manager.registerPreset('weekWithSummary', {
    timeColumnWidth     : 20,
    rowHeight           : 24,
    resourceColumnWidth : 100,
    displayDateFormat   : 'Y-m-d',
    shiftUnit           : 'WEEK',
    shiftIncrement      : 1,
    defaultSpan         : 10,
    timeResolution      : {
        unit      : "HOUR",
        increment : 6
    },
    headerConfig        : {
        bottom : {
            unit     : 'DAY',
            align    : 'center',
            renderer : function (start, end, config, index, eventStore) {
                return eventStore.getEventsInTimeSpan(start, end).length;
            }
        },
        middle : {
            unit     : 'DAY',
            align    : 'center',
            renderer : function (start) {
                return Ext.Date.dayNames[start.getDay()].substring(0, 1);
            }
        },
        top    : {
            unit       : 'WEEK',
            dateFormat : 'D d M Y'
        }
    }
});

As of the latest release, you now have access to the eventStore of the panel where the header is being rendered. This makes it really easy to do summaries like this. As you can see in the code snippet above, all we do is to query the eventStore based on the header cell start/end dates.

Rendering event bars into the timeline header

We recently had a request to draw event bars in the header. This requires a little more work but is still really simple to achieve. Here’s an image showing the desired output (part of the new ‘columnsummary‘ sample).

Screen Shot 2014-05-05 at 16.30.34

Since we’re now trying to render time dependent data (i.e. it depends on the timeline visualization), we have to get access to the scheduler view which has APIs to get the position based on a date. First we create a new view preset with an empty bottom row renderer.

Sch.preset.Manager.registerPreset("dayWeek", {
    timeColumnWidth     : 100,
    rowHeight           : 24,
    resourceColumnWidth : 100,
    displayDateFormat   : 'Y-m-d G:i',
    shiftUnit           : "DAY",
    shiftIncrement      : 1,
    defaultSpan         : 5,
    timeResolution      : {
        unit      : "HOUR",
        increment : 1
    },
    headerConfig        : {
        bottom : {
            unit     : "DAY",
            renderer : null // set in scheduler initialization
        },
        middle : {
            unit       : "DAY",
            align      : 'center',
            dateFormat : 'D d M'
        },
        top    : {
            unit     : "WEEK",
            align    : 'center',
            renderer : function (start, end, cfg) {
                return Sch.util.Date.getShortNameOfUnit("WEEK") + '.' + Ext.Date.format(start, 'W M Y');
            }
        }
    }
});

We also need some data to show in the header. In the sample data, I added some events with a special ‘frozen’ ResourceId set. Here’s the data set loaded:

eventStore         : Ext.create("Sch.data.EventStore", {
    data : [
        {Id : 'e10', ResourceId : 'r1', Name : 'Assignment 1', StartDate : "2010-12-02", EndDate : "2010-12-03"},
        {Id : 'e11', ResourceId : 'r2', Name : 'Assignment 2', StartDate : "2010-12-04", EndDate : "2010-12-07"},
        {Id : 'e21', ResourceId : 'r3', Name : 'Assignment 3', StartDate : "2010-12-01", EndDate : "2010-12-04"},
        {Id : 'e22', ResourceId : 'r4', Name : 'Assignment 4', StartDate : "2010-12-05", EndDate : "2010-12-07"},
        {Id : 'e32', ResourceId : 'r5', Name : 'Assignment 5', StartDate : "2010-12-07", EndDate : "2010-12-11"},
        {Id : 'e33', ResourceId : 'r6', Name : 'Assignment 6', StartDate : "2010-12-09", EndDate : "2010-12-11"},

        {Id : 'special1', ResourceId : 'frozen', Name : 'Summary task', StartDate : "2010-12-02", EndDate : "2010-12-03"},
        {Id : 'special2', ResourceId : 'frozen', Name : 'Important info', StartDate : "2010-12-04", EndDate : "2010-12-07"},
        {Id : 'special3', ResourceId : 'frozen', Name : 'Some text', StartDate : "2010-12-08", EndDate : "2010-12-09"}
    ]
})

In our scheduler, I defined a simple XTemplate rendering a simple DIV for each bar.

this.headerTpl = new Ext.XTemplate('
{text}
');

Then I grab the bottom header row of my custom preset and set a new renderer method which renders these special ‘frozen’ header events.

Sch.preset.Manager.get('dayWeek').headerConfig.bottom.renderer = Ext.Function.bind(this.frozenHeaderRenderer, this);

Now all we have to do is to write the rendering part, by implementing our frozenHeaderRenderer method. We inject all these events in the first header cell, since the getXFromDate method returns values based on the left-most edge of the view.

// Render some special 'frozen' header events which are always shown in the header.
frozenHeaderRenderer : function (start, end, cfg, i, eventStore) {
    var me = this;

    if (i === 0) {
        var eventsInSpan = eventStore.queryBy(function (task) {
            return task.getResourceId() === 'frozen' && me.timeAxis.timeSpanInAxis(task.getStartDate(), task.getEndDate());
        });

        var tplData = Ext.Array.map(eventsInSpan.items, function (task) {
            var startX = me.getSchedulingView().getXFromDate(task.getStartDate());
            var endX = me.getSchedulingView().getXFromDate(task.getEndDate());

            return {
                left  : startX,
                width : endX - startX,
                text  : task.getName()
            }
        });

        return me.headerTpl.apply(tplData);
    }
}

Keeping the header up to date

The last piece of this puzzle is to make sure the header view is up to date. We do this by simply observing the event store for any changes. When events are added to the eventStore, we simply call ‘refresh’ on the TimeAxisColumn instance.

var timeAxisColumn = this.down('timeaxiscolumn');

this.eventStore.on({
    add     : timeAxisColumn.refresh,
    remove  : timeAxisColumn.refresh,
    update  : timeAxisColumn.refresh,
    scope   : timeAxisColumn
});

That’s all it takes. One custom preset, a template and data to apply to the template. I hope you find these tricks useful as you customize your own Scheduler and Gantt components.

Our New Public TeamCity Installation

$
0
0

Today we’re excited to share our new public TeamCity portal with you. If you’re not familiar with TeamCity, it’s a great Continuous Integration (“CI”) tool made by JetBrains.

Screen Shot 2014-05-13 at 12.33.56

We’re happy to report that it’s easy to setup and it has lots of useful configuration options. In our new site, anyone will be able to see our latest test results for all our products. You can also find interesting statistics such as Pass/Fail over time and code coverage.

The great thing about CI-tools such as TeamCity is that they help us make important information easily readable. If you, like us at Bryntum, have multiple projects running in multiple browsers on multiple OS’s – the amount of information can be hard to process and visualize. Thanks to TeamCity, we and all our users can now see all the important numbers and metrics easily on the web. This of course puts more pressure on us to keep the quality of our builds high, since all information is openly available. Another positive change is that anyone interested in using our nightly builds, can now check the health of the builds before deciding. Let’s take a peek at what we did to make this happen.

Using Siesta with TeamCity

As you probably know, we use Siesta to perform all our JavaScript tests. As of the latest Siesta 2.0.6 release, we now fully support integration with TeamCity. This is done by simply adding a new --teamcity parameter to your command line call. If you use PhantomJS, here’s the command line call.

YOUR_SIESTA_FOLDER/bin/phantomjs http://your.harness.url/tests --teamcity --no-color

And if you use Selenium Webdriver, here’s the corresponding line.

YOUR_SIESTA_FOLDER/bin/webdriver http://your.harness.url/tests --teamcity --no-color --browser chrome

In TeamCity, you then add a new project configuration with a few parameters set:

  • “Runner Type” set to "Command Line"
  • “Run” set to "Executable with parameters"
  • “Command executable” set to "YOUR_SIESTA_FOLDER/bin/phantomjs"
  • “Command parameters” set to "http://harness_url/tests --teamcity --no-color"

This is all you need to get started. You can then add additional useful data such as Change Log, Statistics and Code Coverage.

Code Coverage

Since Siesta has code coverage support built-in (thanks to the excellent Istanbul project), we can show this information easily in our CI portal. First you need to add a few extra Siesta Harness configs to setup the code coverage feature.

Harness.configure({
    title : 'Your Awesome Test Suite',
    autoCheckGlobals : true,

    // Code coverage settings
    enableCodeCoverage : true,
    preload : [
    {
        url : 'some-script.js',
        instrument : true
    }
],
...

Once this is done, you can include the code coverage report generated by Siesta by adding a new Report Tab in TeamCity. This is one of the nice things about TeamCity, it’s highly configurable and showing a custom HTML report is as easy as pointing to any HTML file. You can even point to an HTML file inside a ZIP archive (see screenshot below).

Screen Shot 2014-05-13 at 18.24.20

To learn more about adding custom reports, please see the JetBrains documentation. You can read more about setting up Siesta to use its code coverage feature in a previous blog post. The report integrated into TeamCity can be seen below, click the image to see the actual coverage report inside our TC installation.

Screen Shot 2014-05-13 at 13.08.48

Statistics

The statistics tab can be configured to show various charts of the data in TeamCity. We’ve added a few different charts, but the most interesting one for us is to see how the tests pass and fail over time to see trends in our stability. To add custom charts to TeamCity, you need to edit an XML file located in PROJECT_ROOT/pluginData/plugin-settings.xml. Please see this link for more documentation about configuring custom charts. Here’s the XML config we use for one of our graphs.

<custom-graphs>
    <graph title="Test count (based on nightly builds)" seriesTitle="Test group" defaultFilters="showFailed">
        <properties>
            <property name="axis.y.type" value="logarithmic"/><property name="axis.y.min" value="0"/>
        </properties>
        <valueType key="FailedTestCount" title="Failed" color="red" buildTypeId="ExtScheduler2x_NightlyBuild"/>
        <valueType key="IgnoredTestCount" title="Ignored" color="grey" buildTypeId="ExtScheduler2x_NightlyBuild"/>
        <valueType key="PassedTestCount" title="Passed" color="green" buildTypeId="ExtScheduler2x_NightlyBuild"/>
    </graph>
</custom-graphs>

Below is the resulting chart using the XML configuration above.

Screen Shot 2014-05-14 at 10.15.41

Change Log

The change log is also very useful to quickly track down what change may have caused a broken build. You see a full commit log and you can also see all the branching which gives you a great overview.

Screen Shot 2014-05-13 at 18.58.19

IDE Integration

We should also mention that WebStorm has excellent support for TeamCity, giving you live results of tests running inside your IDE. This means less need for tabbing between windows and happier developers.

Screen Shot 2014-05-13 at 12.58.54

To sum up, Siesta + TeamCity is a superb combination which helps you visualize your nightly test runs and code coverage data. We hope you find this blog post useful and we advise anyone interested in Continuous Integration for their SW projects to start using TeamCity. Should you run into any integration issues, please let us know and we’ll try to help you.

Good luck!

Additional Resources


Testing Ext JS 5 apps with Siesta

$
0
0

Over the past few weeks we have received a number of questions from Siesta users wondering about Siesta supporting Ext JS 5. Since Siesta is a generic JS tool, it can of course test any JavaScript code. There is of naturally a slight risk that the Ext JS layer in Siesta may need to be updated if Ext JS itself changes. The user interface for Siesta will continue to use Ext JS 4.2.0, which doesn’t affect your tests at all since this is just for the visualization of the test results. I recently took some time to investigate if our Ext JS tests in Siesta worked with Ext JS 5, and after a few minor tweaks they now pass all our tests. For anyone interested in trying these tests out, you can download our latest Siesta v2.0.7 release from our customer zone or try it online here.

Testing an Ext JS 5 code base

There are no special requirements when testing an Ext JS 5 application, the test code you write will look just like any of your previous Ext JS tests. To demonstrate this, I thought I would take a look at the Ext JS 5 beta SDK, in which you can find a new Ticketing app sample which uses various components and shows charts, grids and team member lists. Click the image to try this sample out.

Screen Shot 2014-05-20 at 10.05.14

I decided to write a few smoke tests for this app and below you can see the Siesta code I came up with. The test is divided into different it sections to make it easier to read and maintain. First it logs into the app, then it exercises a few different sections of it.

describe('Testing the Ticket App example', function (t) {

    t.it('Should be possible to login', function(t) {

        t.chain(
            { waitForCQ : 'window[title=Login - Ticket App]' },

            { click : '>> textfield[inputType=password]' },

            { type : 'foo', target : '>> textfield[inputType=password]' },

            { click : '>> button[text=Login]' },

            { waitForCQNotFound : 'window[title=Login - Ticket App]', desc: 'Login window should be destroyed after login' }
        )
    })

    t.it('Should find various UI elements on the dashboard', function(t) {

        t.chain(
            { waitForCQ : 'app-dashboard', desc : 'Should find dashboard component created' },

            function() {
                t.contentLike('#app-header-username', 'Don', 'Should find current user name in the top right corner');

                t.cqExists('grid[title=Projects]', 'Found projects grid')
                t.cqExists('grid[title=Projects] actioncolumn', 'Found action column in projects grid')
            }
        )
    })

    t.it('Dashboard interactions', function(t) {

        t.chain(
            { click : '>> grid[title="My Active Tickets"] button[text=Refresh]' },

            function(next) {
                t.cqNotExists('window[title^=Edit User]', 'User window not found before clicking Edit')
                next()
            },

            { click : 'grid[title^=Project Members] => .x-grid-cell:contains(Edit)' },

            { waitForCQ : 'window[title^=Edit User]{isVisible()}'},

            { click : '>> window[title^=Edit User] button[text=Close]' },

            { waitForCQNotFound : 'window[title^=Edit User]', desc : 'Edit window destroyed after close is pressed'}
        )
    })

    t.it('Search interactions', function(t) {

        t.chain(
            { click : 'grid[title="Projects"] => .x-action-col-icon.search' },

            { waitForCQ : 'tabpanel grid[title^=Search]', desc : 'Should find Search tab created' },

            { waitForRowsVisible : '>>grid[title^=Search]', desc : 'Search grid should contain rows' },

            { click : '>>combobox[fieldLabel="User"]' },

            function (next) {
                var gridview = t.cq1('>>grid[title^=Search]').getView()
                t.firesOnce(gridview, 'refresh');

                t.cq1('combobox[fieldLabel="User"]').select(2)

                next();
            },

            { click : 'tab[text^=Search] => .x-tab-close-btn'},

            { waitForCQNotFound : 'tabpanel grid[title^=Search]', desc : 'Should not find Search tab after close' }

        )
    })
});

The key to writing stable Siesta tests is to learn Ext.ComponentQuery. You can see above that I use it extensively to target various UI components in the application. Example:

>> textfield[inputType=password]

targets the password field and you can also pinpoint elements inside Ext components by using our Composite Query notation:

tab[text^=Search] => .x-tab-close-btn

This query targets the close icon in an individual tab which has a title beginning with “Search”. You can run this test yourself by clicking here and filter for “smoke”. If you have any questions relating to testing Ext JS 5 apps, our forums are always open.

Running Siesta Tests In The Cloud With BrowserStack

$
0
0

browserstack-logo-600x315

The more tests we write, the more free time we have to improve the quality of our software. Without tests, it’s easy to end up constantly chasing the same bugs again and again after each refactoring. A logical step to improving the quality of a web based application is to make sure it works in all the various browsers out there. Normally you need to support old and sometimes obsolete operation systems, like Windows XP and browsers which require their own VM (IE7, 8, 9 etc). The number of platforms that we want to run our tests on is constantly growing.

One way to solve this requirement is to maintain your own farm of virtual machines with various OS/browser combinations. This can be tricky and will consume lots of your time and resources. Another more elegant way is to use services providing the same infrastructure in the cloud. Thanks to services such as BrowserStack it is now very simple.

This post describes the integration facilities that the upcoming Siesta release (and latest nightly build) provides to access the BrowserStack cloud testing infrastructure.

Authentication

When registering in BrowserStack, you will receive a user name and an access key. You can find these in your BrowserStack account under the “Account -> Automate” section. Later in this guide we will refer to these as “BrowserStack username” and “BrowserStack access key”

Rapid testing

Assuming your local web server is configured to listen at host “localhost” on port 80, all you need to launch your test suite in the cloud
is to sign up for the BrowserStack trial and run the following command:

__SIESTA_DIR__/bin/webdriver http://localhost/myproject/tests/harness.html –browserstack BS_USERNAME,BS_KEY –cap browser=firefox
–cap os=windows –cap os_version=XP

That’s all, the only difference compared to a normal Siesta automated launch is the “–browserstack” option, which is a shortcut performing a few additional actions. We’ll examine what happens under the hood later in this guide.

Note how we specified the desired OS/browser combination using the “–cap” switch (it specifies a remote webdriver capability). For a full list of supported capabilities please refer to http://www.browserstack.com/automate/capabilities

If your web server listens on a different host or port, then the “–browserstack” option should look like:

–browserstack BS_USERNAME,BS_KEY,mylocalhost,8888

Under the hood

Let’s examine what happens under the hood when we use the “–browserstack” shortcut option. In fact, we don’t have to use this shortcut option and can perform all the steps listed below manually.

1) The first thing that happens is that Siesta establishes a local tunnel from your machine to the BrowserStack server, using the BrowserStack binaries.
You can do this step manually by using the batch file in the Siesta package:

__SIESTA_DIR__/bin/browserstacklocal BS_KEY,mylocalhost,myportnumber

When launched successfully, you should see the following text:

Verifying parameters

Starting local testing

You can now access your local server(s) in our remote browser: http://local:80

Press Ctrl-C to exit

2) The “–host” option is set to point to the BrowserStack server, based on your username and access key:

–host=”http://BS_USERNAME:BS_KEY@hub.browserstack.com/wd/hub”

3) The browserstack specific capability “browserstack.local” is set to “true”

To sum up, instead of using the “–browserstack” shortcut option, we could launch the tunnel manually..:

__SIESTA_DIR__/bin/browserstacklocal BS_KEY,mylocalhost,myportnumber

…and specify the command as:

__SIESTA_DIR__/bin/webdriver http://localhost/myproject/tests/harness.html
–host=”http://BS_USERNAME:BS_KEY@hub.browserstack.com/wd/hub”
–cap browser=firefox –cap os=windows –cap os_version=XP
–cap browserstack.local=true

For convenience, instead of setting the “–host” option manually, one can specify “–browserstack-user” and “–browserstack-key” options.

__SIESTA_DIR__/bin/webdriver http://localhost/myproject/tests/harness.html
–browserstack-user=BS_USERNAME –browserstack-key=BS_KEY
–cap browser=firefox –cap os=windows –cap os_version=XP
–cap browserstack.local=true

Conclusion

As you can see, thanks to the excellent BrowserStack infrastructure, launching your tests in the cloud is as easy as specifying one extra argument on the command line. The benefits of cloud testing are obvious – no need to waste time and resources setting up and maintaining your own VM farm, and additionally you can run your test suite in various browsers in parallel.

Additional Resources

The New Sauce Labs Integration

$
0
0

saucelabs-logo

In our previous post, we showed the new support for running tests in the cloud. We have now extended our API to also include support for the superb Sauce Labs service. Using Sauce, you no longer have to worry about setting up and maintaining your own virtual machines. Running tests in the Sauce infrastructure is seamless and only requires you to perform a few initial steps.

Registering With Sauce

When registering an account in Sauce Labs, you will receive a user name (displayed in the right top corner after logging in) and an API key which can be found in the left-bottom corner of the “Account” page. Later in this post we will refer to these as “Sauce Labs username” and “Sauce Labs access key” (or Sauce Labs API key).

Quick And Easy Testing

Assuming your local web server is configured to listen at host “localhost” on port 80, all you need to be able to launch your test suite in the cloud is to sign up for the SauceLabs trial and run the following command:

__SIESTA_DIR__/bin/webdriver http://localhost/myproject/tests/harness.html –saucelabs SL_USERNAME,SL_KEY
–cap browserName=firefox –cap platform=windows

That’s all, the only difference from a normal Siesta automated launch is the “–saucelabs” option, which is a shortcut performing a few additional actions. We’ll examine what happens under the hood later in this post. Note how we have specified the desired OS/browser combination using the “–cap” switch (it specifies the remote webdriver capability). For a full list of supported capabilities please refer to http://code.google.com/p/selenium/wiki/DesiredCapabilities.

If your webserver listens on a different host (mylocalhost for example) or port (8888), then the “–saucelabs” option should look like:

–saucelabs SL_USERNAME,SL_KEY,mylocalhost,8888

Under The Hood

Let’s examine what happens under the hood when we use the “–saucelabs” shortcut option. In fact, we don’t have to use this shortcut option and can perform all the steps listed below manually.

1) The first thing that happens is that Siesta establishes a local tunnel from your machine to the Sauce Labs server, using the Sauce Labs binaries. You can do this step manually by using the batch file in the Siesta package:

__SIESTA_DIR__/bin/sc -u SL_USERNAME -k SL_API_KEY

When launched successfully, you should see the following text:

11 Aug 13:21:22 – Sauce Connect 4.3, build 1283 399e76d
11 Aug 13:21:22 – Using CA certificate bundle /etc/ssl/certs/ca-certificates.crt.
…..
11 Aug 13:22:12 – Starting Selenium listener…
11 Aug 13:22:15 – Sauce Connect is up, you may start your tests.
11 Aug 13:22:15 – Connection established.

2) The “–host” option is set to point to the Sauce Labs server, based on your username and access key:

–host=”http://SL_USERNAME:SL_API_KEY@ondemand.saucelabs.com:80/wd/hub”

To sum up, instead of using the “–saucelabs” shortcut option, we could:

- launch the tunnel manually:

__SIESTA_DIR__/bin/sc -u SL_USERNAME -k SL_API_KEY

- specify the command as:

__SIESTA_DIR__/bin/webdriver http://localhost/myproject/tests/harness.html
–host=”http://SL_USERNAME:SL_API_KEY@ondemand.saucelabs.com:80/wd/hub”
–cap browserName=firefox –cap platform=XP

For convenience, instead of setting the “–host” option manually, one can specify “–saucelabs-user” and “–saucelabs-key” options.

__SIESTA_DIR__/bin/webdriver http://localhost/myproject/tests/harness.html
–saucelabs-user=SL_USERNAME –saucelabs-key=SL_API_KEY
–cap browserName=firefox –cap platform=XP

Conclusion

As you can see, thanks to the excellent Sauce Labs infrastructure, launching your tests in the cloud is as easy as specifying one extra argument on the command line. The benefits of cloud testing are obvious – no need to waste time and resources setting up and maintaining your own VM farm, and additionally you can run your test suite in various browsers in parallel.

Additional Resources

Writing a custom plugin for Ext Gantt 3.x

$
0
0

Since the Gantt 3.0 release is getting closer, it’s time to get a bit more familiar with it. Ext Gantt is currently in Beta-1 stage and the next beta is coming soon. In this post we’ll look at how to write a custom plugin which visually groups child task of a parent task. Here’s an image of what it should achieve.

Writing a plugin skeleton

Writing an Ext JS 5 plugin is a very simple task, and it should be done in the same way as in Ext JS 4. We simply subclass the Ext.AbstractPlugin class and implement the init method called during initialization.

Ext.define("MyApp.TaskArea", {
    extend : 'Ext.AbstractPlugin',

    init : function (panel) {
       // TODO: cool things
    }
});

In the init method, we have access to the Gantt panel to which the plugin instance is attached. Here we will do any setup that needs to be done for our plugin. In our case, we first need some sort of Template that we will use for the rendering. We can simply put this directly on the class prototype. This template needs to be used as the parentTaskBodyTemplate which controls the inner content of every parent task. We simply append a bit of markup to each existing parent task to make sure we don’t break the default rendering.

Ext.define("MyApp.TaskArea", {
    extend : 'Ext.AbstractPlugin',

    tpl : '
', init : function (panel) { var bodyTpl = (panel.parentTaskBodyTemplate || Gnt.template.ParentTask.prototype.innerTpl) + this.tpl; Ext.apply(panel.getSchedulingView(), { parentTaskBodyTemplate : bodyTpl }); this.panel = panel; this.taskStore = panel.getTaskStore(); } });

We also save a reference to the Gantt panel and its task store since we need them later.

Template and rendering

Next step is to do the actual sizing of the rendered custom elements in the view. To do this, we need to listen to a few different events of the Gantt view as you can see below.

Ext.define("MyApp.TaskArea", {
    extend : 'Ext.AbstractPlugin',

   
    init : function (panel) {
        ...
        
        this.panel = panel;
        this.taskStore = panel.getTaskStore();

        panel.getSchedulingView().on({
            refresh    : this.repaintAllAreas,

            // These are also fired on expand / collapse
            itemupdate : this.repaintAllAreas,
            itemremove : this.repaintAllAreas,
            itemadd    : this.repaintAllAreas,
            scope      : this
        });
    },

    repaintAllAreas : function() {}
});

As you can see, we want to react to each full refresh, row update, row removal and to each new row being added. For each such event we simply resize all visible task group elements, all we need to do is to set a new proper height, which we can get by asking the view for the last child of each parent (recursively). Below is the full implementation, which in total is only 70 lines of JS and a little CSS. You can try the example out yourself here:

Ext.define("MyApp.TaskArea", {
    extend : 'Ext.AbstractPlugin',

    tpl : '
', init : function (panel) { var bodyTpl = (panel.parentTaskBodyTemplate || Gnt.template.ParentTask.prototype.innerTpl) + this.tpl; Ext.apply(panel.getSchedulingView(), { parentTaskBodyTemplate : bodyTpl }); this.panel = panel; this.taskStore = panel.getTaskStore(); panel.getSchedulingView().on({ refresh : this.repaintAllAreas, // These are also fired on expand / collapse itemupdate : this.repaintAllAreas, itemremove : this.repaintAllAreas, itemadd : this.repaintAllAreas, scope : this }); }, getLastVisibleChild : function (parentNode) { var result; if (!parentNode || parentNode.isLeaf() || !parentNode.isExpanded()) { result = parentNode; } else { result = this.getLastVisibleChild(parentNode.lastChild); } return result; }, repaintAllAreas : function () { var view = this.panel.getSchedulingView(); var viewNodes = this.panel.getSchedulingView().getNodes(); Ext.Array.each(viewNodes, function (domNode) { var node = view.getRecord(domNode); if (node && !node.isRoot() && !node.isLeaf() && !node.isMilestone() && node.isExpanded()) { this.refreshAreaSize(node); } }, this); }, refreshAreaSize : function (parentTask) { var view = this.panel.getSchedulingView(); var el = view.getElementFromEventRecord(parentTask); var areaEl = el.down('.gnt-taskarea'); var store = view.store; var lastVisibleChild = this.getLastVisibleChild(parentTask); var height = 0; if (lastVisibleChild && lastVisibleChild !== parentTask) { var indexDelta = view.store.indexOf(lastVisibleChild) - view.store.indexOf(parentTask); height = indexDelta * view.timeAxisViewModel.getViewRowHeight() - 5; } areaEl.setHeight(height); } });

A little CSS to finish it off:

.gnt-taskarea {
    position         : absolute;
    top              : 100%;
    left             : 0;
    margin-left      : -1px;
    background-color : inherit;
    border-width     : 0;
    opacity          : 0.2;
    filter           : alpha(opacity=20);
    width            : inherit;
    border-radius    : 4px;
    z-index          : -1;
    pointer-events   : none;
}

.gnt-taskarea-inner {
    width            : 100%;
    border-radius    : inherit;
    border-width     : 1px;
    border-style     : solid;
    border-color     : inherit;
    height           : 100%;
    opacity          : 0.7;
    filter           : alpha(opacity=70);
    background-color : transparent;
}

Summing up

Time to give this example a try! Note that it is based on Ext JS 5 and our first Gantt 3 beta release. We hope this plugin can be useful for you and that it demonstrates how easy it is to take control over the Gantt rendering process to customize the appearance of the chart. Let us know what you think and if you have other ideas of useful plugins. Happy hacking!

Road to 3.0: Making the Ext Scheduler Responsive

$
0
0

In modern web apps, supporting responsive layouts has become very important due to the varying screen sizes across desktop, mobile and tablet devices. The new Ext JS 5 platform has really nice support for responsive rendering out of the box.

responsive-design

What does ‘responsive’ mean?

On Wikipedia, we can learn the following definition of Responsive Web Design:

Responsive Web Design (RWD) is a web design approach aimed at crafting sites to provide an optimal viewing experience—easy reading and navigation with a minimum of resizing, panning, and scrolling—across a wide range of devices (from mobile phones to desktop computer monitors).

While “traditional” RWD is normally using grid layouts and percentage based sizing coupled with CSS3 media queries, Sencha uses a more JavaScript oriented approach. The reason for this is that Ext JS has its own layout engine and doesn’t rely much on the browser CSS engine for layouting. This approach means that you can easily run any JS when the size of the viewport changes, to adapt your user interface. Let’s see how this works.

The new ‘responsiveConfig’

The responsive functionality is provided by the Ext.mixin.Responsive mixin. This mixin is activated anytime you add the Ext.plugin.Responsive plugin to a Component. Here’s a basic sample of how it can be used:

Ext.create({
     xtype: 'viewport',
     layout: 'border',

     items: [{
         title: 'Some Title',
         plugins: 'responsive',

         responsiveConfig: {
             'width < 800': {
                 region: 'north'
             },

             'width >= 800': {
                 region: 'west'
             }
         }
     }]
 });

The code above will render the panel to the ‘north’ section if the viewport width is less than 800px, and ‘west’ otherwise. Anytime the viewport width is changed, these conditions are reevaluated and the corresponding set methods are called for the properties (setRegion in this case). So how can we make something cool with this feature for the Ext Scheduler component? I think setting the orientation based on the device orientation is a good start. Here’s how the code would look:

new Sch.panel.SchedulerGrid({
    ...,
    plugins          : [
        'responsive'
    ],

    responsiveConfig : {
        "width=height" : { mode : "horizontal" }
    }
});

As you can see, we simply change the ‘mode’ property (meaning setMode will be called) when device orientation changes from landscape to portrait and vice versa. In total, about 5 lines to get that working – not bad. Here’s how it looks:

Landscape – Horizontal

IMG_0009

Portrait – Vertical

IMG_0008

This is just a simple example of what you can do, you can change any properties easily by having setter methods with corresponding names (setRowHeight, setTimeColumnWidth etc). Let’s take it a bit further now. We can change other properties too for smaller screen sizes. To change row height and column display, here’s all you have to do:

new Sch.panel.SchedulerGrid({

    columns                 : [
        {
            text      : 'Name',
            width     : 200,
            dataIndex : 'Name',
            plugins   : 'responsive',
            responsiveConfig : {
                "width

Summing up…

We hope you’re convinced of how easy it is to add responsive rendering support to your application. It really only takes a few lines of code, that’s all. Happy hacking!

Kanban Task Board 2.0 With Ext JS 5 support.

$
0
0

Today we’re thrilled to announce the latest releases of our Kanban Task Board: v1.0 based on Ext JS 4 and v2.0 based on Ext JS 5. We will continue to support the 1.0-branch with bug fixes, but new development and features will go into the 2.0 branch. Apart from the new platform support, one of the really cool things about the 2.0 release is the new “Kanban-Scheduler” demo included. It contains two interesting features that we’ll go through next. If you’re low on time, I made a little intro video showing these features.

Screen Shot 2014-10-08 at 16.12.53

Task board meets Ext Scheduler

The first cool thing about this sample: The two components share the same data model structure and can therefore easily visualize the same data set. This means configuring both components with the same Ext JS data store as seen below:

{
    xtype         : 'schedule',
    flex          : 3,
    startDate     : new Date(2014, 9, 13),
    eventStore    : taskStore,
    resourceStore : resourceStore
},
{
    xtype         : 'kanban',
    flex          : 5,
    taskStore     : taskStore,
    resourceStore : resourceStore
}

The nice thing here is that any change made in one of the components will be immediately reflected in the other since all the wiring is already done. Both components simply observe the data stores for any changes.

Rapid Prototyping With Live Template Changes

If you click the Settings icon on the left, you see the second cool thing about this sample. Two panels allow you to dynamically change the HTML template and any styles you want, right in the browser. That’s right. You type, and the view is immediately updated with your changes. This is done using a trick which generates a new Ext.XTemplate for the Task Board view.

Screen Shot 2014-10-10 at 09.23.48

Modifying CSS And Styles

In the same way, you can create your own custom style rules and the browser shows your changes live. This is great when you want to play around with the visual appearance without slow page reloads.

Screen Shot 2014-10-10 at 09.26.27

Summing up…

The Task Board is a very flexible component, allowing you to define any number of task states and any visual HTML template to render the tasks. As seen in the example above, you can also share data stores with any number of other components to visualize the data in different ways. We hope it gives you good inspiration of what can be accomplished using our products. Please share any feedback you have in the comments section below. Happy Hacking!

Ext Gantt: The New Task Split Feature

$
0
0

Sometimes a task is not worked on continuously, the work may be stopped as planned or due to unexpected circumstances. Let’s say a machine breaks down, in such a scenario the Ext Gantt supports splitting the task into segments. The easiest way to split a task is to use the new context menu option. Simply right click on the task where you want the split to happen and choose the “Split task” option.

Screen Shot 2014-11-07 at 09.16.41

The ‘split’ API method

You can of course also call the ‘split‘ method of the Gnt.model.Task class. Here’s how you call the split method manually:

var taskStore = new Gnt.data.TaskStore({
        root : {
            expanded : true,
            children : [{
                Id        : 1,
                StartDate : new Date(2014, 10, 3),
                Duration  : 4,
                leaf      : true
            }]
        }
    });

    var task = taskStore.getById(1);
    console.log(task.getSegments()); // null - task is not segmented

    // Will split the task in two segments, 1 day + 3 days
    task.split(new Date(2014, 10, 4));

    console.log(task.getSegments().length) // => 2 segments now
    console.log(task.getSegments()[0].getDuration()) // 1
    console.log(task.getSegments()[1].getDuration()) // 3

All you have to do is to provide the date when you want the split to be made. By default, a gap of 1 task ‘duration unit’ will be introduced after the split. The second split in the example above will hence start on November 5. You can control the gap by passing two additional parameters after the split date, one for the duration, and another argument for the duration unit.

The ‘merge’ API method

Merging a split tasks is just as easy as splitting. Simply drag two pieces together in the UI and they will be merged automatically. You can of course do the same via the merge method of the Task API:

var taskStore = new Gnt.data.TaskStore({
        root : {
            expanded : true,
            children : [{
                Id        : 1,
                StartDate : new Date(2014, 10, 3),
                EndDate   : new Date(2014, 10, 7),
                leaf      : true
            }]
        }
    });

    var task = taskStore.getById(1);
    console.log(task.getSegments()); // null - task is not segmented

    // Will split the task in two segments, 1 day + 3 days
    task.split(new Date(2014, 10, 4));

    // Will merge the two segments
    task.merge(task.getSegment(0), task.getSegment(1));

    console.log(task.getSegments()) // => null, no segments now

Data Structure

When loading data with segmented tasks, the incoming JSON structure should look like this:

{
        "Id"                : 11,
        "leaf"              : true,
        "Name"              : "Investigate",
        "PercentDone"       : 50,
        "StartDate"         : "2010-01-18",
        "Segments"          : [
            {
                "Id"                : 1,
                "StartDate"         : "2010-01-18",
                "Duration"          : 1
            },
            {
                "Id"                : 2,
                "StartDate"         : "2010-01-20",
                "Duration"          : 2
            },
            {
                "Id"                : 3,
                "StartDate"         : "2010-01-25",
                "Duration"          : 5
            }
        ]
    }

It’s pretty self explanatory, you simply describe the segments in order with a date and duration (and optional duration unit). Note that the segments themselves are not part of the TaskStore directly, and can only be queried on the task level. The same structure as above will be used when tasks are serialized and sent to the server to be saved.

Try it out right now!

To try this feature out and do your own first task split, head over to our advanced and right click one of the tasks. Happy splitting!


Ext Gantt: Defining Task Constraints

$
0
0

When working with tasks in a large project schedule, some tasks usually have date constraints attached to them. These constraints define strict rules for when a task can start or end. For example, Santa Claus must finish delivering all gifts before end of Christmas (a Finish-No-Later-Than constraint).

Constraint Types

Ext Gantt supports six types of task constraints:

  • * Must-Start-On (alias ‘muststarton’)
  • * Must-Finish-On (alias ‘mustfinishon’)
  • * Start-No-Earlier-Than (alias ‘startnoearlierthan’)
  • * Start-No-Later-Than (alias ‘startnolaterthan’)
  • * Finish-No-Earlier-Than (alias ‘finishnoearlierthan’)
  • * Finish-No-Later-Than (alias ‘finishnolaterthan’)

Each of the constraints listed above is defined by a type (a string) and a target date. Therefore, two new fields have been added to the Task model class – “ConstraintType” and “ConstraintDate“. In your data, you simply set these two fields to define your task constraints. Example task with a “Must-Start-On” constraint:

{
        "Id"                : 123,
        "leaf"              : true,
        "Name"              : "Some Task",
        "Duration"          : 10,
        "PercentDone"       : 50,
        "ConstraintType"    : "muststarton",
        "ConstraintDate"    : "2010-01-18",
        "StartDate"         : "2010-01-18"
    }

As you see, the constraint is defined and “satisfied” since the task starts on the same date as the constraint date. To let your users define and change constraints, simply include the two constraint columns and enable cell editing.

var gantt = new Gnt.panel.Gantt({
        columns       : [
            {
                xtype : 'namecolumn'
            },
            {
                xtype : 'constrainttypecolumn'
            },
            {
                xtype : 'constraintdatecolumn'
            }
        ],

        plugins : 'cellediting',
        ...
    });

Screen Shot 2014-11-07 at 12.37.52

Now if the user modifies a constraint, or the task start date, end date or duration – a prompt will be shown presenting the user with the following options:

* Cancel the change and do nothing
* Remove the constraint
* Move the task to satisfy the constraint

constraint1

If the user checks the “Don’t ask again” checkbox and hits the Ok-button, the same action will be applied to all future constraints violations. (Note: This flag is not persisted during page reloads).

Using the Task Constraints API

You can of course also change a constraint manually using the Task API. If a constraint is violated by your change, the constraint resolution window will popup to allow the user to take the correct action.

var task = taskStore.getNodeById(1);
    
    task.setStartDate(new Date(2014, 1, 1);
    
    // Constraint already satisfied
    task.setConstraint('muststarton', new Date(2014, 1, 1);

    // Will show the constraint resolution window, since the constraint is no longer fulfilled
    task.setStartDate(new Date(2014, 1, 2);

The constraint information can also be edited in the TaskEditor window, under the Advanced tab.

API details and asynchronous behavior

Constraints verification is now built-in into the Gantt data layer. Regular methods that affect the start or end date of a task (like setStartDate/setDuration etc) now check for possible constraint conflicts and allow a user to resolve them. Since receving user input to such a conflict resolution is not synchronous, all such methods has been made asynchronous in the general case. These methods all accept a callback, which will be called after all the changes caused by the method has completed. This also includes changes in the positions of any dependent tasks. If constraints are not used, all methods remain synchronous so backward compatibility is fully preserved.

Every time a constraint conflict happens, a constraintconflict event is fired by the task store.

Summing up…

This has been a basic intro to constraints, though there is much more details if you need advanced features. You can define own constraint types too and define how they should restrict the task. For more information, please see the API documentation. Happy hacking!

Speeding Up Siesta – Sandboxing Now Optional

$
0
0
Sandboxing – what is it exactly..?

Every since the first Siesta release, tests have always been executed in their own iframes – “sandboxed”. This feature of Siesta assures that tests get a fresh context as they start and can’t interfere with other tests by changing global browser properties or defining global variables. Another big bonus is that you don’t need to manually clean up after your tests. As a sandboxed test is being started, this is roughly what is happening under the hood.

  • 1. Siesta creates a new iframe and adds it to the page
  • 2. The JS and CSS resources defined in your preloads are injected into the iframe
  • 3. Siesta waits for the resources and the DOM to be ready and then executes the test code.

This is a pretty high price to pay, especially for pure unit tests which run fast. The setup is typically measured in seconds, whereas a unit test could finish in 100ms. For the worst case, this means a magnitude of 10-20x of setup time compared to test code execution time. Which of course tells us that there could be room for improvement for certain well structured tests.

Introducing the “sandbox” config option

In the latest nightly build (download here, a new config option has been added to Siesta called “sandbox” and it’s important enough to deserve a special blog post.

The sandbox option is true by default which keeps the old behavior intact, but you can now set it to false on either the Harness or on test groups. Disabling the sandbox feature takes a bit of thought, as it should not always be used. Disable sandboxing only when:

  • 1. You are sure that your tests do not modify any global state
  • 2. A group of tests share the same JS/CSS resources, i.e. tests don’t preload individual scripts
When not to use sandboxing

If your tests are creating global variables or in other ways modifying properties of the BOM, they are likely not suitable for sharing context with other tests. Let’s illustrate what we mean by “modifying global state”:

// 1st test file 
// ============================

// "Helper" is a config object
Helper = { prop : 'value' }

// setting some global config before the test
MyApp.someConfig        = "someValue"

// registering some store
var store   = new Ext.data.Store({ storeId : 'store' })

// 2nd test file 
// ============================

// "Helper" is an ExtJS model class
Ext.define('Helper', { .... })

// FAIL: the "MyApp.someConfig" is expected to have a default value
// but it has been changed during execution of test 1
t.is(MyApp.someConfig, 'defaultValue', "`someConfig` has a default value")

// The store with id `store` is kept from the 1st test
t.notOk(
    Ext.data.StoreManager.get('store'), 
    "Should be no store with id `store`"
)

As you can see, without sandboxing, there can be conflicts in even the simplest code. Most of them are related to shared state – global variables and singletons. If you are careful with the shared state, and your tests rely fully on local variables within the main test function, you should be able to disable sandboxing and improve your test suite performance significantly.

Implementation

Let’s now see what will happen if the sandbox option is disabled for a group of tests. Siesta will collect all tests having this option disabled and split them into chunks. Every chunk will have exactly the same values for the test configs which influence the initial setup of the page: preload, alsoPreload, hostPageUrl, requires and loaderPath. Example:

Harness.start(
    {
        group       : 'Group 1',
        sandbox     : false,
        preload     : [ 'file1.js' ],
        items       : [
            'test1.t.js', // test1 and test2 will be run in the same "sandbox"
            'test2.t.js',
            {
                // this test will have a separate sandbox, since the `preload` option
                // (which influence initial page setup) is different
                url         : 'test3.t.js',
                preload     : [ 'file2.js' ]
            }
        ]
    },
    ...
)

The 1st test in every chunk will be run normally. Starting from the 2nd one, tests will skip the isReady check and setup methods. This is because all the setup is done for the 1st test. This behavior may change (or be made configurable) in the future.

Important: Before a test is launched in a “dirty” sandbox, a cleanup is performed. On the “raw” browser testing level, the cleanup process includes removal of all “unexpected” global values (as defined by the expectedGlobals config) and DOM cleanup (the <body>’s innerHTML is cleared). In the Ext JS layer, instead of clearing the DOM, all Ext components created by the test are destroyed.

Results

Of course we’ve tried this new option on the test suites of our own products. For large groups of raw JS tests – ones that don’t involve DOM interaction or event simulation, we’ve seen a major speedup of up to 20 times. Tests that were taking minutes now complete in seconds. For UI tests with user interactions, the speed gain is less obvious due to the internal waiting inside of the tests, but it is still noticeable and such tests are approximately 3-5x times faster.

We’ll be investigating additional possibilities of performance improvements, like running several “chunks” in parallel, but so far the results are very promising. Below are two screenshots of running a group of 68 tests in our suite with sandbox on and off. You can see for yourself why we are so excited about this:

Sandbox enabled (old behavior)
Screen Shot 2014-11-26 at 23.57.36

Sandbox disabled
Screen Shot 2014-11-26 at 23.58.08

For this group of tests, there is a 15x speed increase compared to before.

Should I use it too?

The disabled sandbox option works very well in our test suites, but there can still be edge cases to polish. We definitely advise you to play with it. Just disable this option for some groups of tests and see if the tests still pass unmodified. Possibly you will need to make some minor changes in your tests. Anyway, please let us know about your experience in our forum!

Customer Showcase: Cloud Coach

$
0
0

What is Cloud Couch?

Cloud Coach provides enterprise-class project management, PPM and PSA software businesses can utilize to simplify everyday tasks, increasing productivity and allowing growth by giving team members the time to concentrate on core aspects of the business.

logo3

A key feature of Cloud Coach’s project management software is the Gantt chart. We reached out to Cloud Coach team to ask them why the Gantt chart is a critical component to their project success.

Using Ext Gantt For Customer Implementations

At Cloud Coach, we use our own application for implementing our software with our clients. We always have multiple implementations on the go meaning coordinating customer consultations, installations, customizations and training gets complicated.

By utilizing the project gantt view, we get a visual timeline of all our projects on the go across our business. We can see individual project progression and click into any project to drill into the details. The gantt view gives us the ability to assign tasks to specific people just by clicking on the individual task. We also use the ‘one-click’ critical path tool to monitor the status of any tasks that directly impact the customer’s installation completion date. The critical path tool provides real time updates as the project progresses letting us keep not only our entire team up to speed on the installation progress, but also our customers!

image00

The integration with our application

Our product is built on Salesforce.com using visualforce and apex to deliver the gantt chart. The gantt chart is integrated with the database using ajax requests to build the data set.

We have substantially customized the gantt chart to facilitate project task resourcing using our own tools, integration with Salesforce’s social platform Chatter, reporting of a tasks ‘health’, as well as dependency creation and recalculation using our logic. Bryntum has provided a solid and versatile rendering platform for our data.

Summing up…

The reception from our customers and own staff of integrating Ext Gantt into our product has been outstanding. It has given us the ability to substantially cut down time invested in developing project timelines and the visual simplicity of the chart makes it easy for users to see, and relay critical information.

As we continue to raise the bar with new software development, we unequivocally look forward to continuing to work with Bryntum!

Introducing The Crud Manager

$
0
0

We’re excited to introduce a new data level class called “Crud Manager” in our 2.5 and 3.x branches. This class is generic and will help you a lot when dealing with multiple dependent stores. We have two specialized implementations of the CM for the Scheduler and Gantt components, and in this post we’ll see how it makes life easier when implementing the Gantt chart.

Background

Dealing with Gantt related data has been a bit of a pain in the past so let’s take a look at some of the challenges the Crud Manager will help you solve. In previous versions of Ext Gantt 2.x, the implementer had to manage loading and saving of each individual store. This is bad for at least three reasons:

  • * Performance: Using multiple ajax proxies means multiple ajax request being used.
  • * Data consistency: It’s impossible to use an “all-or-nothing” approach with transactions if saving is split into multiple requests.
  • * Complexity: Some changes have dependencies on other data entities. Consider a new assignment, before it can be saved, its Task and Resource much first be saved to assert that they get proper Ids assigned. This type of dependency means that such multi-store save operations must be queued in a specific order. This introduces unnecessary complexity.

Additionally, this approach meant that the server never got to “see the full picture” of the update at once. Without seeing all the changes coming in, it’s much harder to do proper validation of the new data.

Loading Data

In previous versions of Ext Gantt, you could see something like this in the console when instantiating the Gantt chart and its data stores.

Screen Shot 2014-12-25 at 11.15.00

4 requests are made to load the initial data, and of course more if you use calendars or additional data stores. Not very optimized. When calling the load method the Crud Manager will perform a single ajax request to fetch data for all its stores.

var crudManager   = Ext.create('Gnt.data.CrudManager', {
    autoLoad        : true,
    taskStore       : taskStore,
    transport       : {
        load    : {
            url     : 'php/read.php'
        },
        sync    : {
            url     : 'php/save.php'
        }
    }
});

This is of course much more performant than doing one request per store. The server should then return a container object with a “success” property as well as separate JSON objects for each separate data set. Here is an example:

{
    "success"      : true,

    "dependencies" : {
        "rows" : [
            {"Id" : 1, "From" : 11, "To" : 17 },
            ...
        ]
    },

    "assignments" : {
        "rows" : [
            {
                "Id"         : 1,
                "TaskId"     : 11,
                "ResourceId" : 1,
                "Units"      : 100
            },
            ...
        ]
    },

    "resources" : {
        "rows" : [
            {"Id" : 1, "Name" : "Mats" },
            {"Id" : 2, "Name" : "Nickolay" },
            ...
        ]
    },

    "tasks" : {
        "rows" : [
            {
                "Id"                : 1,
                "Name"              : "Planning",
                "Duration"          : 10,
                "StartDate"         : "2010-04-23"
            },
            ...
        ]
    }
}

The CRUD manager will also perform a ‘smart’ loading of all these data sets to cause minimal refreshes of the views that observe it. For example, on the initial load – loading assignments, dependencies and resources before loading the taskStore assures that only one full refresh of the view will be performed. In previous versions of the Gantt chart, each loaded store would cause a full view refresh.

Saving Data

The Crud Manager is very similar to a regular Ext JS data store when it comes to saving. You can either use the autoSync config to always trigger a save upon any change to the data. Or you can handle this yourself by calling ‘sync’ when you want to save:

crudManager.sync(function() {
   // A simple callback
});

When calling save on the Gantt crud manager, this will trigger an ajax request passing the following data:

{
    requestId   : 123890,
    type        : 'sync',
    revision    : 123,

    tasks      : {
        added : [
            { $PhantomId : 'q1w2e3r4t5', Name : 'smth', ... },
            ...
        ],
        updated : [
            { Id : 123, PercentDone : 100 },
            ...
        ],
        removed : [
            { Id : 345 },
            ...
        ]
    },

    dependencies      : {
        added : [...],
        updated :  [...],
        removed :  [...]
    }
}

You can see 3 additional properties being sent along with the data updates. They are:

  • * requestId – A unique request identifier shipped with any request
  • * type – The request type (‘sync’ – for sync requests)
  • * revision – The server revision number

When the server receives this data, it can of course do any type of data operations based on what’s coming in. Some changes may not be allowed, other changes might have side effects. The server needs to respond with a data object containing all the delta changes it performs so that the client is up-to-date with the database. Below you can see a a sample sync response object:

{
        requestId   : 123890,
        success     : true, // `true` to indicate a successful response
        revision    : 124,  // new server revision stamp
        tasks      : {
            rows : [
                // processed phantom record initially sent from client
                { $PhantomId : 'q1w2e3r4t5', Id : 9000 },
                // processed updated record initially sent from client
                { Id : 123, SomeField2 : '2013-08-01' },
                // record added/updated by server logic (not sent from client)
                { Id : 124, SomeField : 'server generated', SomeField2 : '2013-08-01' }
                ...
            ],
            removed : [
                // processed removed record initially sent from client
                { Id : 345 },
                // record removed by server logic (not sent from client)
                { Id : 145 },
                ...
            ]
        },

        dependencies      : {
            rows : [...],
            removed : [...]
        }
    }

For each store we have two sections rows and removed where rows holds all records added or updated by the server. As a bare minimum, for phantom records sent from the client, the server returns a combination of phantom Id and real Id (Id assigned by server). If the server decides to update some other record (either phantom or a persisted one) or create a new one, it should return an object holding a combination of the real Id and those field values. The field values will be applied to the corresponding store record on the client side. The removed array holds Ids of records removed by the server, whether initially sent from client or removed due to some server logic.

Managing Additional Stores

You can of course have the Crud Manager take care of loading and saving for your own custom stores too. For example, you might want to visualize a number of global dates in your schedule using the Lines or Zones plugin. Such data could easily be handled by the Crud Manager:

var zoneStore = new Sch.data.EventStore({
    storeId : 'zones'
});

var cm = new Sch.data.CrudManager({
    autoLoad      : true,
    eventStore    : eventStore,
    resourceStore : resourceStore,
    transport     : {
        load : {
            url : 'data.js'
        }
    },
    stores : [zoneStore]
});

Summing up

You can already see the CrudManager in action in some of our examples, such as the Advanced Gantt sample. We’re hoping this new data class will make your life easier and we look forward to hearing your feedback. For further information about the Crud Manager, please have a look in our Guides section.

Siesta License & Pricing Update

$
0
0

Effective immediately, Siesta Standard is no longer generally available as a single developer license. We now offer Siesta licenses in these sizes only:

  • * 5-pack ($2,450)
  • * 10-pack ($4,600)
  • * 20-pack ($8,300)

If you already have a single Siesta Standard license, you will still be able to extend support at the old rate.

Siesta Lite will remain a free download, just as before. Startups or solo entrepreneurs can still contact us to obtain a discount.

If you have any questions about the new licensing policy, please feel free to contact us at any time through email or our contact form.

Viewing all 370 articles
Browse latest View live